Is stock volume a useful approximation to sales volume?
Systembolaget releases in detail sales figures infrequently. Which is a shame, because a lot of important product decisions depend on this data.
However, they release stock level data on an almost daily basis. The stock data also includes a huge amount of geographic data than the sales figures lack. If we can use stock data as a proxy for sales data, we can make some of these important decisions far more quickly and in response to events. Also, even more importantly, we may be able to use stock level data for individual store locations to infer things about the sales for that specific store.
Having an up-to-date and geographically detailed view of sales would help producers a lot. Can stock levels be a useful approximation for this?
What are we comparing and how?
I’ll be comparing the average stock levels for the year 2020 with that year’s sales figures.
Average stock level: The total stock level (across all of Sweden) has been recorded by our system hundreds of time for each and every product this year. For each product I’ll take the arithmetic mean of all these measurements through time.
Sales figures: That’s simply the total units sold per product, which can be calculated from the official annual report.
The tool I’ll be using to compare them is the “Pearson’s correlation coefficient”, which will tell me about the statistical relationship between those two values. It will be a number between -1 and 1, where -1 is perfectly negatively correlated, 0 is uncorrelated and 1 is perfectly positively correlated. “Negatively” means one increases as the other decreases, positively means they increase and decrease together. What I want to see, in order to confidently use stock levels to make sales-based business decisions is a number close to 1.
Crunch the numbers
Here is the graph of units sold to average total stock volume.
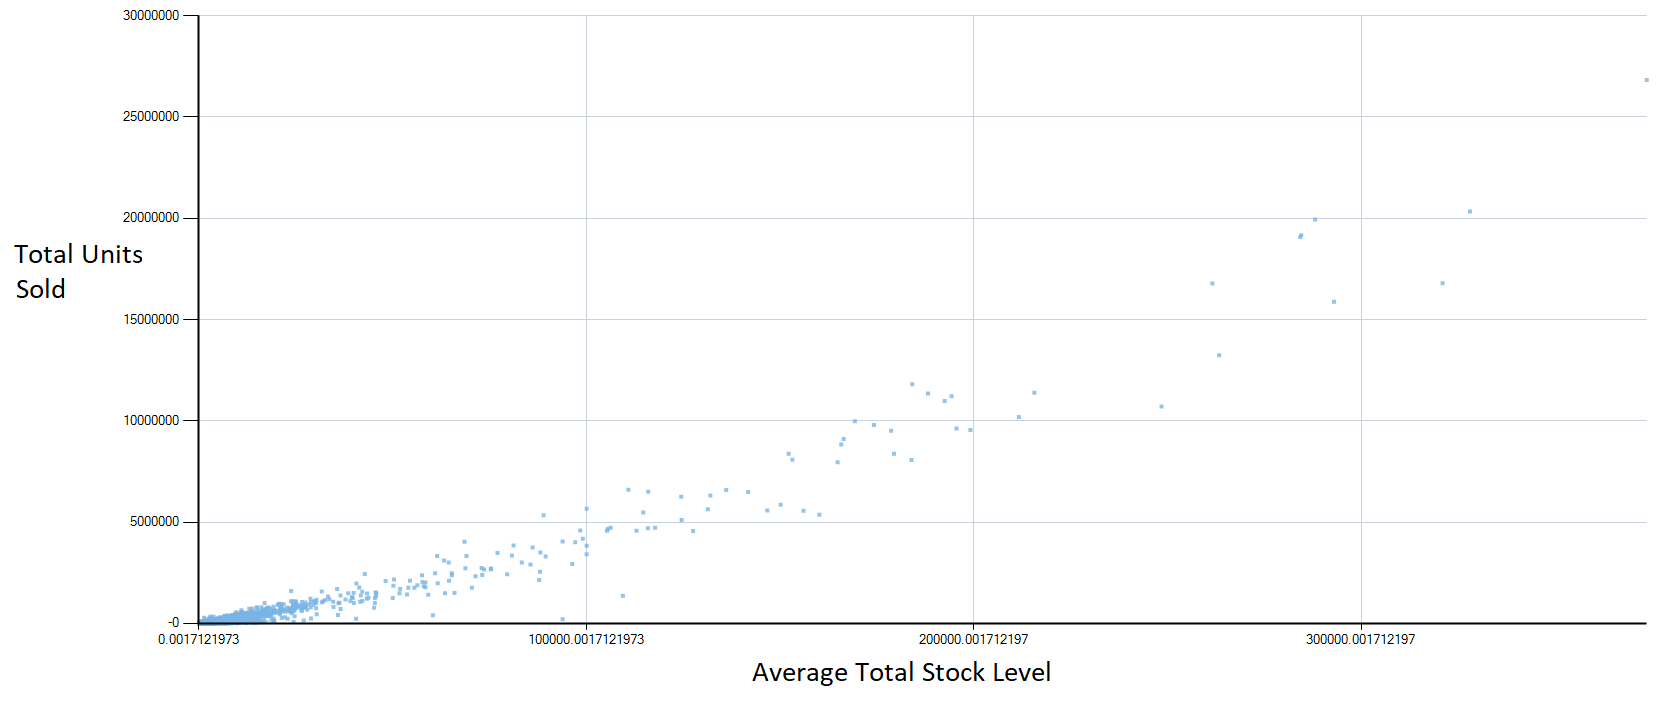
It looks very positively correlated. And in fact the Pearson’s correlation coefficient is 0.96.
Conclusion
This means stock volume it is useful as an approximation for sales. That makes sense, as shops ought to stock what they sell, there are obvious advantages there for the shop. But if you’re a Nordic Alcohol monopoly, it also has the “disadvantage” that your stock figures “leak” your sales figures.
It will take more maths to figure out exactly how to calculate one from the other and exactly what the error bars from that calculation would be. But it’s clear that having constant access to stock level data is a definite advantage for commercial decision makers.
Comments